Since 1965, the spread between the yields of 3-Year and 5-Year Treasury bonds has inverted eight times. Seven of those inversions were immediately followed by a recession. Last week, this segment of the Yield Curve inverted again, for the first time since the Great Recession.
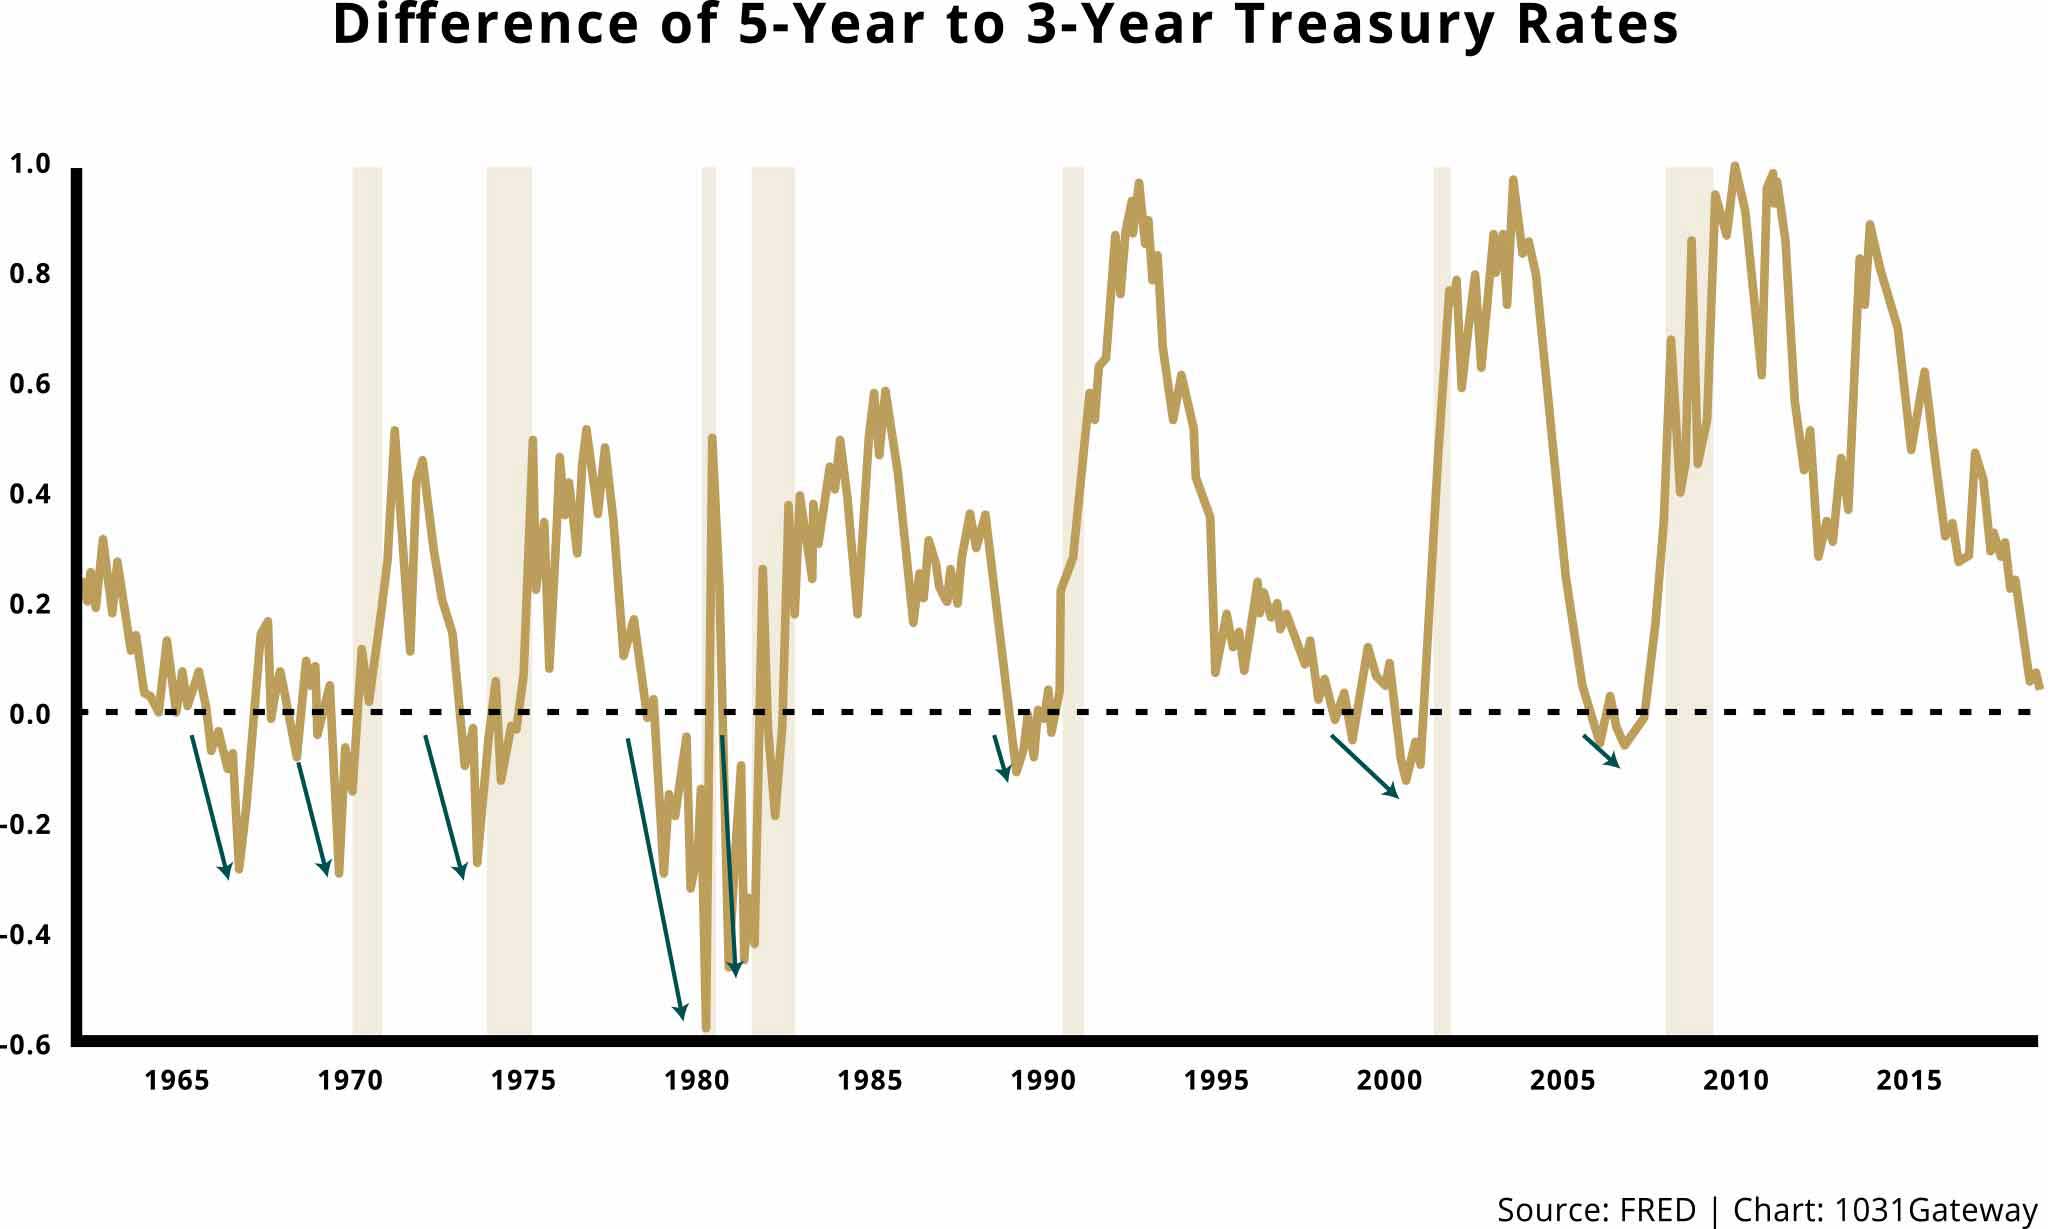
The chart above shows the historical spread between the 3-Year and 5-Year U.S. Treasury bond. The shaded areas indicate recessions. Only one inversion, in the mid-’60s, was not immediately followed by a recession (it took a few extra years).
The Yield Curve has been one of the most reliable indicators of the end of an economic cycle. Some question whether the Yield Curve can still offer relevant insight. They point to rare counterexamples or argue that the changing nature of trading or the economy has compromised the Yield Curve as a market indicator. But these arguments oppose decades of historical precedents. Similar arguments were made when the Yield Curve inverted in late 2005, just prior to the Great Recession. How many investors, particularly real estate investors who operate in an illiquid market, wished they would have made adjustments when the Yield Curve inverted during the last economic cycle?
This article will cover what you need to know about the Yield Curve, and what it means for real estate investors today.
What is the Treasury Yield Curve?
The Treasury Yield Curve is a linear representation of the different interest-rates (or “yields”) that the U.S. Treasury is offering on a given day, organized by the lifetime of the bond. Here’s an image of it in December 2016:
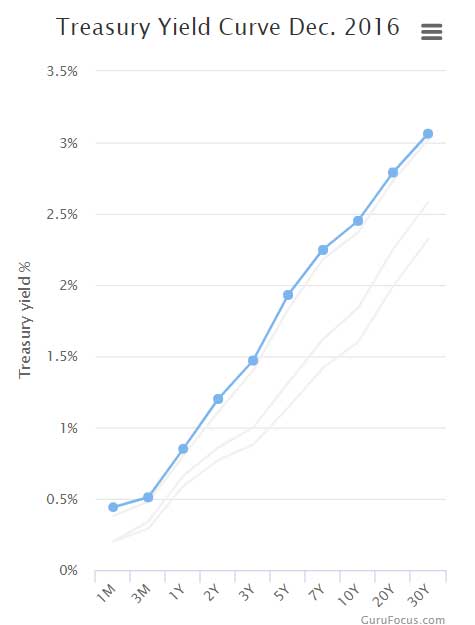
The markers on the line graph show the yield at a given time for each U.S. Treasury bond. The shape of the Yield Curve changes over time as the yield premium of each bond changes with daily purchasing in the primary market and trading in a secondary market.
Many things affect the yield premiums for U.S. Treasury bonds; the most influential is whether investors discern a future change to inflation. Bonds are set at a fixed interest rate, so as inflation grows it erodes the value of the bond’s future cash flow or purchasing power. When investors think that future inflation will increase, then the yield premiums also increase to maintain the bond’s future value. Conversely, in a deflationary environment, the long-term yield premiums decrease, and the Yield Curve flattens, or even inverts.
That brings us to today. The healthy Yield Curve of 2-years ago which indicated confidence that economic growth will occur as time progresses now has a slouch. Here is what this December Yield Curve looks like:
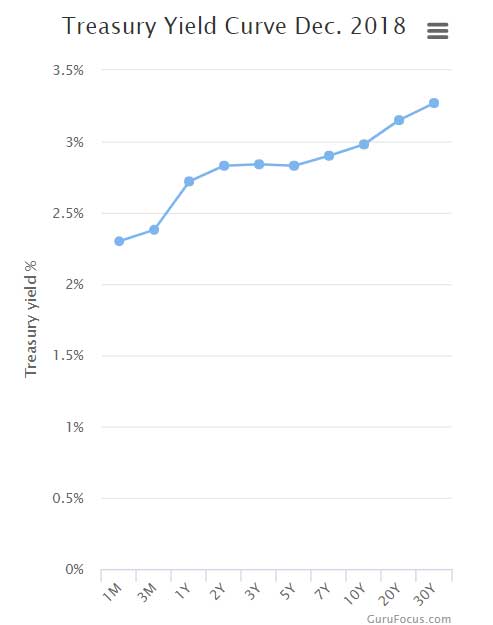
A segment of the Yield Curve has flattened: both the 1-year and 5-year bonds are offering the same yield (2.83%). More concerning is the segment that has inverted: the 3-year bond has a 2.84% yield, and the longer term 5-year bond has a 2.83% yield.
What Does a Flattening or Inverted Yield Curve Mean?
There’s a common saying, “if you want to know where the economy is going, look at the bond market.” The bond market reflects the view of an immense scope of investors trading billions of dollars in U.S. Treasury debt daily. This makes it an excellent gauge of market sentiment for future economic conditions.
A flattening Yield Curve means that the bond market sees signs of a slowing economy. Yield premiums move in step with the bond market’s economic forecast. When the bond market determines that growth is slowing and markets are contracting, yield premiums on lengthier bonds decrease. As we see in the chart that shows the historical yield spread between the 3-Year and 5-Year bonds, when the bond market inverts the Yield Curve by purchasing long-term bonds at a yield rate lower than short-term bonds, a recession almost always follows.
A flat or inverted Yield Curve does not cause a recession, but it has consistently warned that the economy is nearing, or has reached, the end of its growth term. The reasons for the last seven recessions vary, but the conditions that started those recessions occurred during economic slowdowns that were signaled in advance by inversions of the Yield Curve.
How Should a Real Estate Investor Respond to a Flattening or Inverted Yield Curve?
Real estate investors should begin moving into long-term positions with stable cash flows. This means property where a tenant is positioned to thrive in a slowing economy (such as a retailer of non-discretionary goods and services). The lease should be long-term (7+ years), double- or triple-net, and guaranteed by a parent corporation with an investment grade credit rating. During the Great Recession, this kind of investment produced stable cash flow through the most significant economic downturn since the Great Depression. An investor can create an additional hedge of security by diversifying by tenant and geographic location.
Perhaps you think that the strategy is solid, but the execution is improbable: how could you find a property with tenants that meet these criteria?
One means of successfully carrying out the stable, long-term cash flow strategy is to invest in Delaware Statutory Trust (DSTs) that adheres to the above acquisition criteria. By doing this, you can defer capital gains taxes on the sale of your investment property by performing a 1031 Exchange, because ownership in a DST may be considered “like-kind” by the IRS. You can select an investment offering where a proper due diligence team has vetted the risks and determined that the properties are fit to produce income in an economic downturn. And, since DSTs can own more than one property, you may be able to identify a DST that will diversify your investment without needing to make the huge capital expense of sole-ownership over multiple properties.
If you are interested in discussing this option in greater detail, fill out the form to the right and we will connect you with an advisor that we ourselves trust, who can provide you with expert guidance concerning the many real estate investment offerings on the market with an eye for securing your capital and income through the next recession.